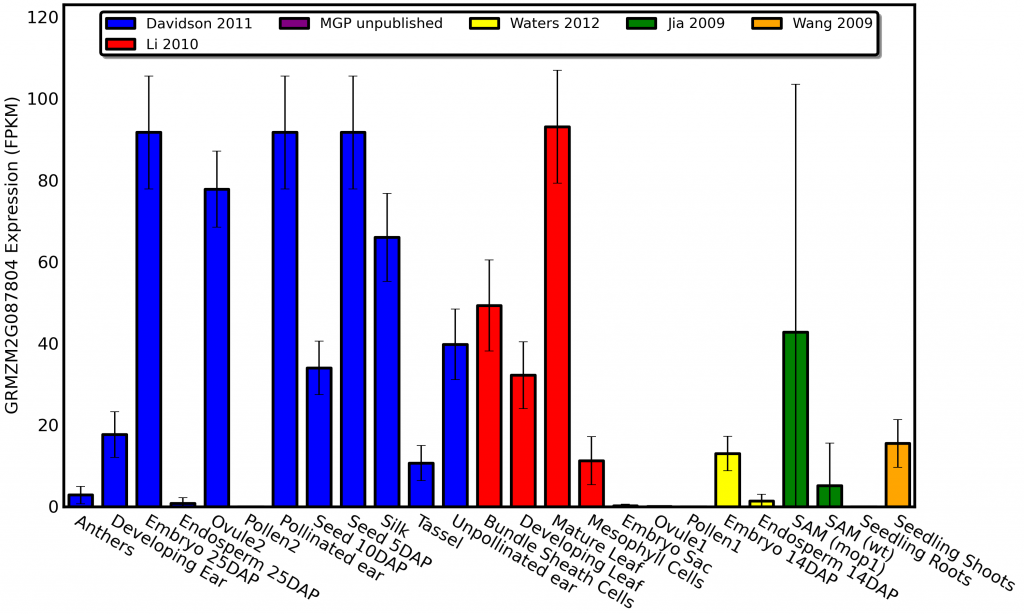
qTeller isn’t just for generating spreadsheets full of data on genes within an genomic region. It can also visualize published expression data for a single gene. For example here is the expression pattern of a gene called golden plant2 involved in regulating photosynthetic development in maize which was first described all the way back in 1926 in an article in the american naturalist:
As you can see golden plant2 is expressed at high levels in photosynthetic tissues and not expressed at all in tissues like roots, endosperm, and pollen. Do you know how long it would have taken me to profile the plant-wide expression pattern of a gene this comprehensively by isolating RNA from different tissues using qPCR? WEEKS! Do you know how long it took for me to get the same level of insight with qTeller? 90 seconds!
Do you know how long it’ll take you to regenerate this same analysis? 30 seconds. Just click this link. There have been so many awesome RNA-seq papers coming out recently for maize. I know when I arrive in Portland on Thursday for the Maize Genetics Conference I’m going to see a whole lot more even bigger/better RNA-seq datasets which people haven’t finished writing up yet. Some of these datasets have been on posters since the very first maize meeting I went to back in 2009 when I was a wide-eyed first year and may _never_ get published.* But others will be published weeks or months from now, making this visualization all the more powerful.
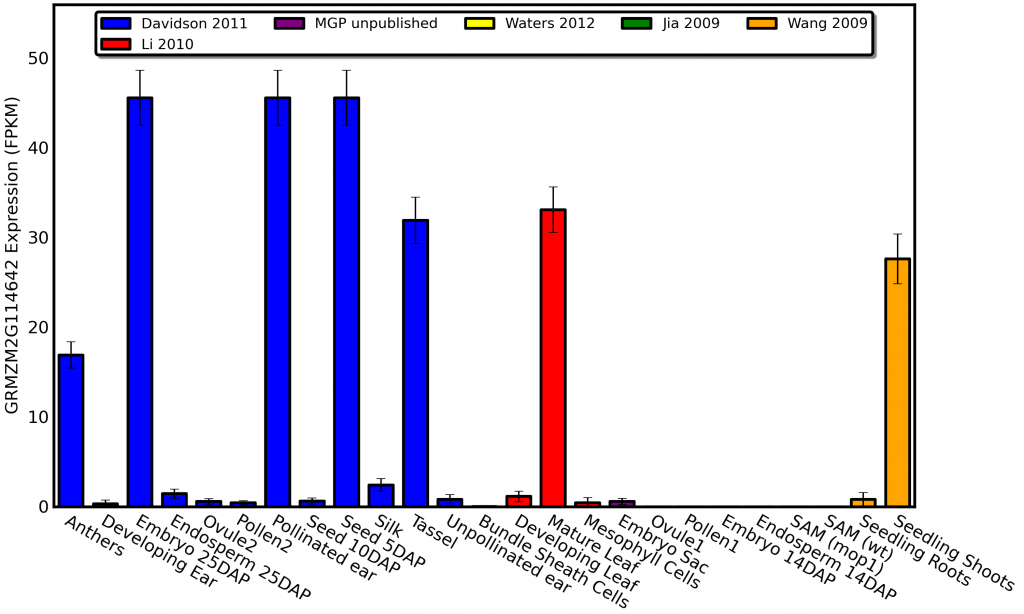
But for now, MORE EYE CANDY:
Glossy1 mutants change the type of wax produced on the leaves of developing maize seedlings, so it makes sense that the gene shows high expression in both maize seedlings and mature leaves. I can even sort of explain away the high expression in developing seeds and embryos since the the primordia which will eventually become the first leaves of the next generation of corn plants are beginning to form, But why in the world does glossy1 show such high levels of expression in anthers?
*Here is the relevant excerpt from my previous rant on data analysis:
I recently did the math on a PLoS Genetics paper published in late 2009 based on on a single in-depth analysis of RNA-seq comparisons of mutant and non-mutant siblings. Today we could generate the same dataset, with twice the depth of sequencing for less than $1000 dollars. (INCLUDING regent costs). The takeaway lesson here: just because your dataset was expensive to generate doesn’t mean you don’t have to worry about the competition stealing the glory if you take more than a year to publish.


qTeller, sweet. slow to publish, not sweet.
Comment by dustin von vielfraßmeister mayfield — May 3, 2012 @ 9:42 pm