I recently go back from the maize meeting. I mentioned before that big part of the reason to do poster presentations is to get comfortable discussing ones research with people who haven’t specialized in the exact same subject. In my case, my poster got a fair bit of interest which was great. (Although I was surprised which parts people were most interested in.) But there were also a couple of concepts I had a lot of trouble getting across.
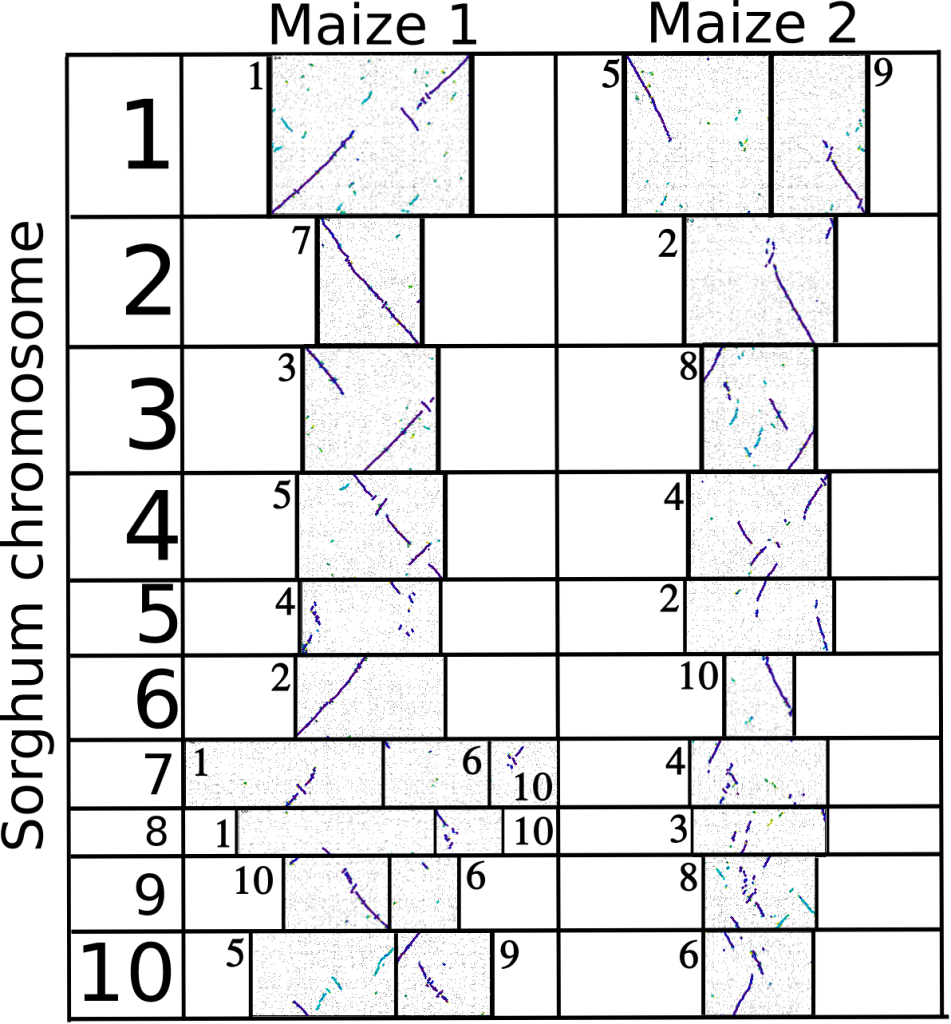
It’s too late to do me any good at the maize meeting, but I have created the figure I think I needed to explain those ideas. Too late for the maize meeting, but maybe I can squeeze it into my qualifying exam proposal. Or maybe the next time I get a chance to give a talk on campus. Let’s just not get into how much of my morning I spent putting this together, and pretend it was a good investment of my time ok?
Right after its whole genome duplication, the ancestor of maize had twenty chromosomes. Through rearrangements and fusions that number has since dropped back to ten, but it’s still possible to reconstruct the twenty paleo-chromosomes of maize by comparing the order of genes on the maize chromosomes to order of genes in sorghum, a related species of grass/grain that didn’t experience the same whole genome duplication and whose overall genome probably looks a fair bit like the unduplicated ancestor of maize.
The purple lines represent orthologous genes between maize and sorghum. Notice how you can trace a line of purple all the way from top to bottom for both maize1 and maize2 (except for maybe at the bottom of the maize2-region equivalent to sorghum chromosome 6 this looks like it was actually just a bug in the analysis).
This shows, in the most graphical way I can manage, that the genome of maize is made up of two genome copies, each equivalent to the whole genome of sorghum.
Nevertheless. I, through the power of Python*, have split the maize genome in twain. In those rare moments when the excitement about the actual research I do wanes I can still enjoy the fact that I know how to do dramatic, if not scientifically impressive, things like this.
Caveats:
- That doesn’t mean every single gene in sorghum has two copies in maize. After the duplication, many duplicate genes were lost, but the conserved order of genes remains.
- This is only one possible way of arranging the duplicated chromosomes of maize. I’ve grouped the paleo-chromosomes that have lost fewer genes relative to sorghum into maize 1 and the paleo-chromosomes that have lost more genes relative to sorghum into maize 2. But there’s no proof that’s a biologically relevant way to group them. There are 2^9 possible ways to arrange the pairs of chromosomes, and only one of those will accurately reflect the relationships of the chromosomes in the the original duplicated maize genome.
*As well as CoGe’s SynMap and all the various computational tools incorporated into synmap.

Another cool post James…
You noticed that sorghum 6L is having one homeologous region missing in maize? When I looked at some old dot plots I did a while ago, looks like maize-10L is covering all the *entire* length of sorghum-6; same as maize-2S. maybe my problem, but it doesn’t hurt to check.
Comment by Haibao Tang — March 26, 2010 @ 5:02 pm
When I re-generated the dotplot, it looks complete to me as well, which makes sense because a gap that big should have lit up some of my other analysis like fireworks.
I will have to figure out what went wrong with this particular dot plot. Thanks Haibao!
Comment by James — March 27, 2010 @ 8:30 am